See this infogrpahic that Capterra created. I found it sort of surprising, because while HubSpot contains features like marketing automation, I would not call HubSpot marketing automation. What do you think about the data / rankings?

See this infogrpahic that Capterra created. I found it sort of surprising, because while HubSpot contains features like marketing automation, I would not call HubSpot marketing automation. What do you think about the data / rankings?
 I am starting to take more of the questions I get by email, twitter and other means and post the responses here, exposing it to more than one person.
If you read this blog at all you know that I love marketing data. There is a new study by Edison Research with data on Twitter out that I was fortunate enough to get a a preview of. The most interesting stats to me were theones about awareness and usage for Twitter and Facebook (I really wish they had included LinkedIn...).

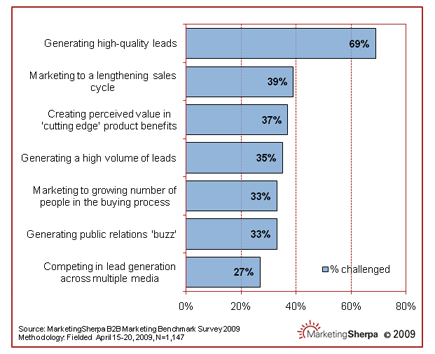
Lead generation, specifically quality leads, is the top challenge for B2B marketers. It always has been, and it always will be. Leads are like a drug, once your sales team has some, they want more - and they always ask for higher quality until you start handing them signed purchase orders. So it didn't surprise me that this MarketingSherpa study showed that quality lead generation was the top challenge. What surprised me was how much lead generation was ahead of the other categories... check it out: 69% of marketers said quality lead generation was the top challenge, and all the other categories were in the 30's. Remarkable. Notice too that just a large volume of lead generation is also on the list at 35%.
I speak a lot at different marketing events, and am always looking to add data to my presentations. Data helps tell a story and provide proof points for what you are presenting. But, I also found that good data and charts on marketing topics were not easy to find in one place. The data existed, it was just hard to find quickly and easily. Knowing that we had a lot of data at HubSpot, I compiled a presentation of over 50 marketing graphs and charts from all the different reports and blog articles we have created. You can see the presentation below, and you can download the original file of marketing charts and graphs as well.
I love data. Netflix makes available rental data by zip code. Mash that up with a map and you can get some cool stuff. This article on NYTimes.com has a cool graphic that allows you to see rental popularity by different titles and zip codes.
